Use Expressions and Formulas
The DynamicPDF Designer, included with the DynamicPDF API, is a graphical tool for creating PDF reports visually. In this example, you use expressions in a simple report to illustrate Designer's ability to add expressions to customize report data.
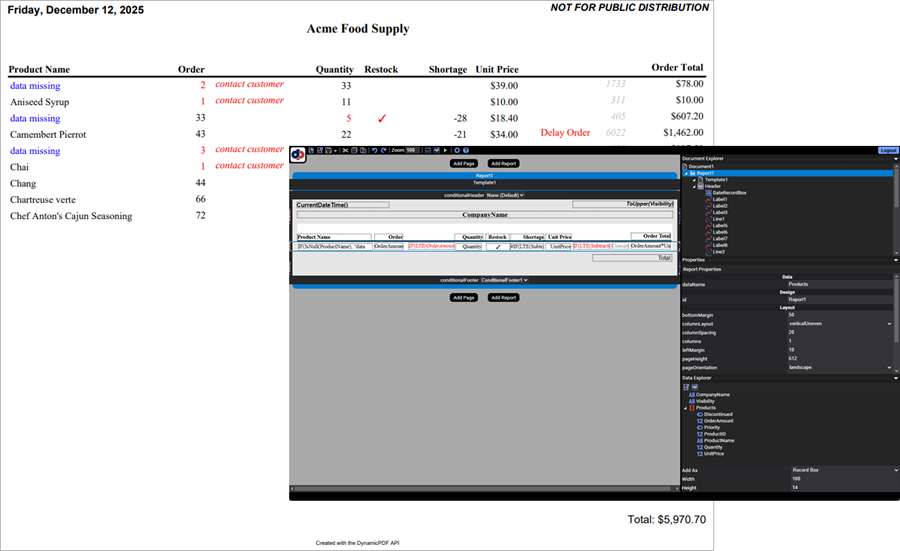
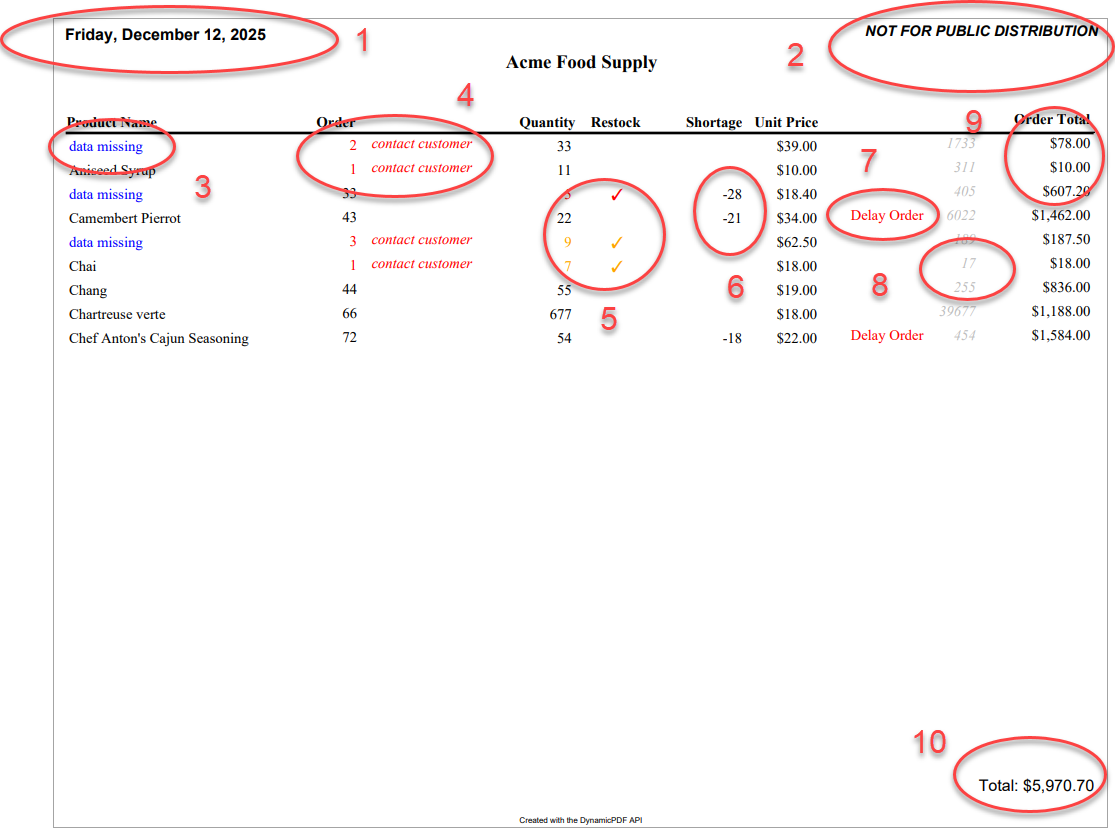
The following report illustrates how to use expressions and formatting to produce a PDF report. The report features the following formatting:
- display the date in the report's header,
- display the report's status in all caps,
- list "data missing" when a product name is null and make the text color blue,
- display order amounts five and below as red and indicate that the customer should be contacted,
- make the quantity available red or yellow, and include a check mark when the quantity available is running low,
- calculate and display the shortage when an order is larger than the quantity available,
- specify that an order should be delayed when there is not enough stock to fulfil a priority customer's order,
- display a code that is the product id and the quantity on hand,
- display the order total, and
- display the grand total for all orders.
1. display the date in the report's header
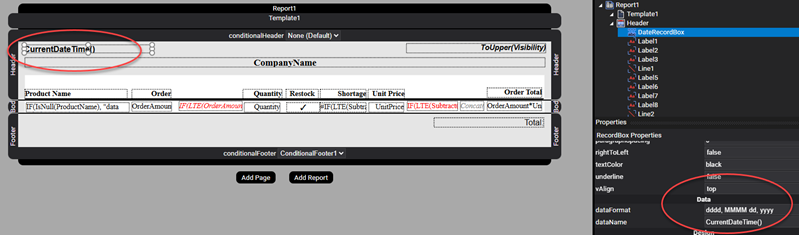
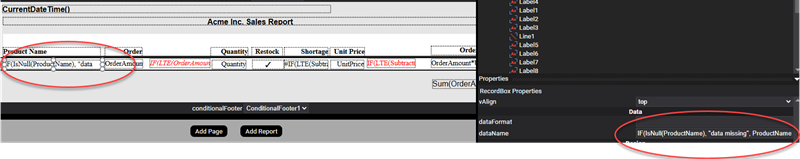
The first thing to notice is that the report's header uses the CurrentDateTime() function to return the report's date by adding the function to the dataName property of a RecordBox instance. It also applies formatting by specifying dddd, MMMM dd, yyyy in the element's dataFormat property.
2. display the report's status in all caps
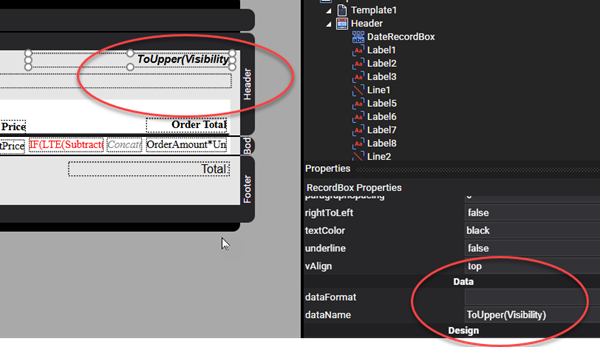
The report's layoutdata has a JSON element named Visibility. The report display's this element in the header and capitalizes the value ToUpper(Visibility).
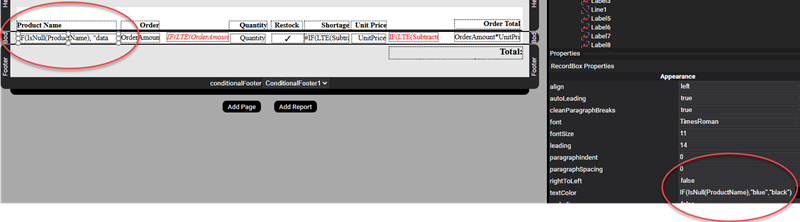
3. list "data missing" when a product name is null and make the text color blue
The report contains a RecordBox element where the dataName is an expression. This expression also checks for a null ProductName value IF(IsNull(ProductName), "data missing", ProductName) and replaces the missing value with data missing. The element also adds an expression to the textColor property, where when missing the text's color is blue otherwise it is black IF(IsNull(ProductName),"blue","black").
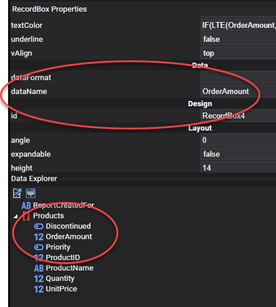
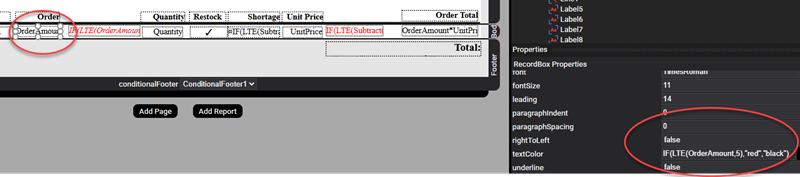
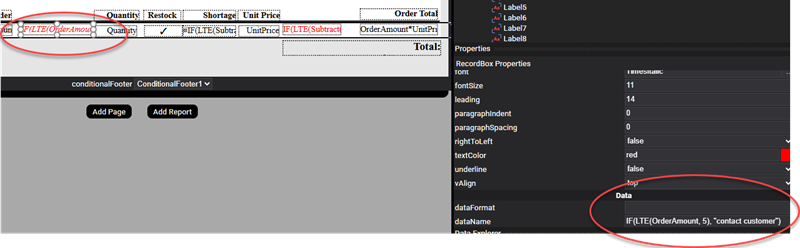
4. display order amounts five and below as red and indicate the customer should be contacted
The report contains a RecordBox for the OrderAmount data element. If the OrderAmount is less then or equal to five, then make the text red by entering IF(LTE(OrderAmount,5),"red","black") expression in the textColor property.
Also add a RecordBox that displays "contact customer" if the customer's order is less than or equal to five items IF(LTE(OrderAmount, 5), "contact customer").
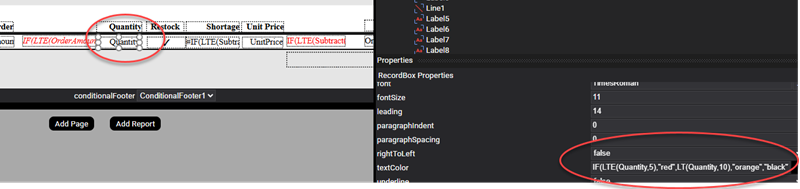
5. make the quantity available red or yellow and include a check mark when quantity available is running low
The Quantity data element lists how many items are available in stock. If there are between ten and five items, then make the text color orange, if it is less than five then make it red, otherwise make it black IF(LTE(Quantity,5),"red",LT(Quantity,10),"orange","black").
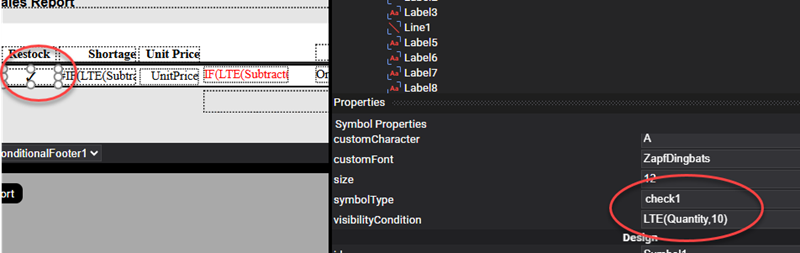
When quantity is less then or equal to ten items, display a checkmark to indicate the item needs restocking LTE(Quantity,10).
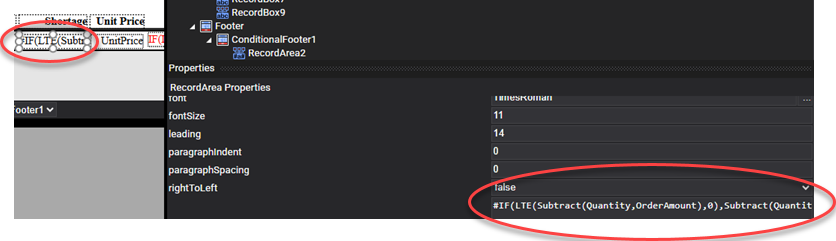
6. calculate and display the shortage when an order is larger than the quantity available
The report displays the shortage when a quantity ordered is more than the amount available in stock. It subtracts Quantity from OrderAmount and if negative it displays the shortage #IF(LTE(Subtract(Quantity,OrderAmount),0),Subtract(Quantity,OrderAmount))#.
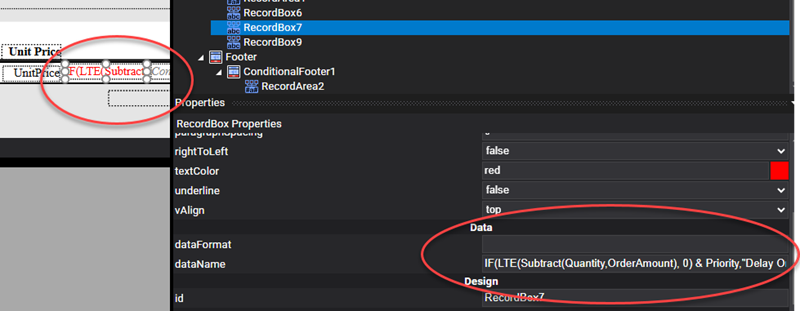
7. specify an order should be delayed when there is not enough stock to fulfil a priority customer's order
The report also checks to see if the Priority flag is true, if true and there is a shortage then it adds text indicating the customer should be contacted as they are a priority customer IF(LTE(Subtract(Quantity,OrderAmount), 0) & Priority,"Delay Order").
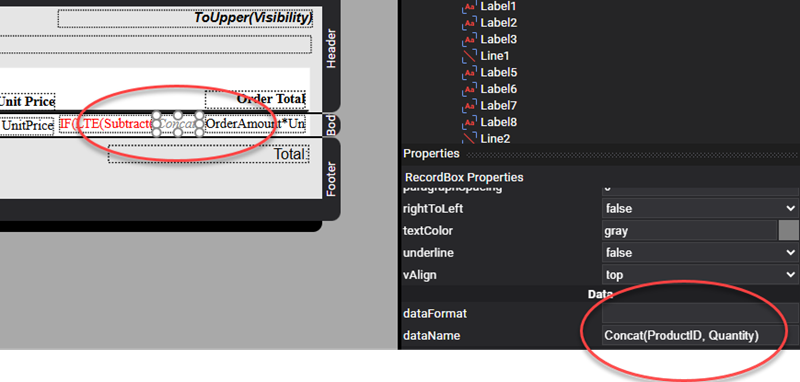
8. display a code that is the product id and the quantity on hand
The report lists a code that is the Quantity concatenated to the ProductID and displays it on the report Concat(ProductID, Quantity).
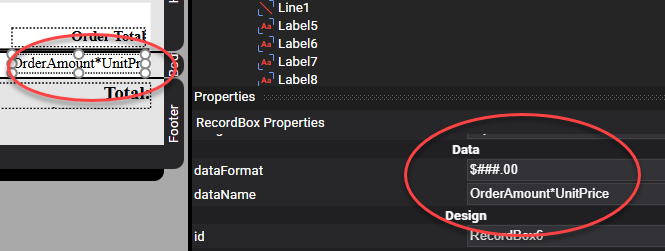
9. display the order total
The report displays the total for each order as the OrderAmount * UnitPrice and formats the amount $###.00.
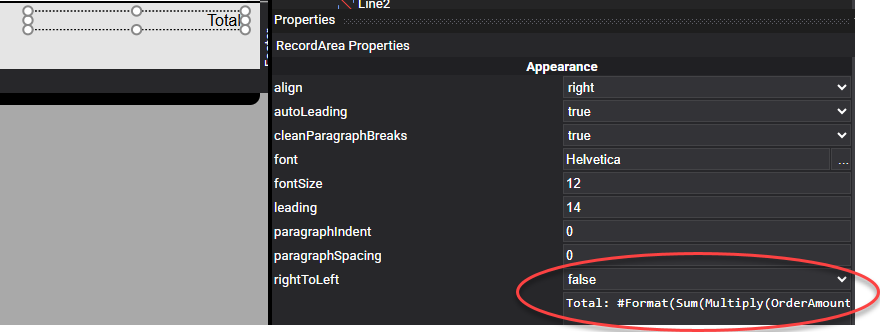
10. display the grand total for all orders
Finally, in a conditional footer, the report sums each order's total and presents the grand total Total: #Sum(OrderAmount*UnitPrice)#.
This example is just a few of the many expressions and formatting available when using Designer, for a complete list of available expressions refer to Expressions documentation.
More Information
For more information on using Designer refer to one of our many tutorials and the Users Guide documentation. Also refer to the Designer Examples documentation page in the Users Guide for numerous examples illustrating Designer's capabilities. Our blog also has numerous tips and tricks for using Designer.
![]()