Overview
The DynamicPDF Designer is a layout tool used to create templates that are then used to create PDF documents using the pdf and the dlex-layout endpoints. Layout elements are dragged, dropped, resized, and positioned to create a template as a DLEX file. The DLEX file, combined with a JSON dataset, is then used via the DynamicPDF API's pdf or dlex-layout endpoints. The following topics list the DLEX document sections, major Designer Interface Layout elements, and then describes the major features of Designer.
| Section | Documentation |
|---|---|
| Document | Document |
| Page | Page |
| Report | Report |
Use the dlex-layout and pdf endpoints to process DLEX files created using Designer.
| Designer Layout Element | Documentation |
|---|---|
| AztecBarcode | AztecBarcode Layout Element Details |
| ContentGroup | ContentGroup Layout Element Details |
| DataMatrixBarcode | DataMatrixBarcode Layout Element Details |
| FormattedRecordArea | FormattedRecordArea Layout Element Details |
| Image | Image Layout Element Details |
| Label | Label Layout Element Details |
| Line | Line Layout Element Details |
| LinearBarcode | LinearBarcode Layout Element Details |
| Link | Link Layout Element Details |
| NoSplitZone | NoSplitZone Layout Element Details |
| PageBreak | PageBreak Layout Element Details |
| PageNumberingLabel | PageNumberingLabel Layout Element Details |
| RecordArea | RecordArea Element Details Layout Element Details |
| RecordBox | RecordBox Element Details Layout Element Details |
| Rectangle | Rectangle Layout Element Details |
| SoftBreak | SoftBreak Layout Element Details |
| Subreport | Subreport Layout Element Details |
| Symbol | Symbol Layout Element Details |
The designer-usersguide-examples GitHub project contains numerous examples illustrating the many different components of a DLEX document. The Samples folder in your DynamicPDF cloud storage also contains numerous example projects. Refer to the Designer Examples documentation for more information.
Main Window
Designer's UI consists of a toolbar along the application's top, the document window, and the properties window.
Every Designer report MUST have associated JSON data. You cannot use Designer without specifying data.
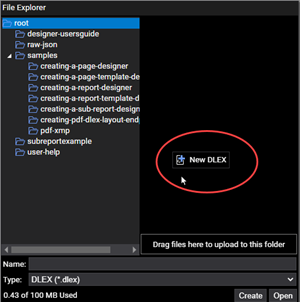
When opening Designer with no DLEX file loaded, you are presented with the File Explorer. You must either open a DLEX file from the File Explorer, add a file to your File Explorer from your local system, or create a new DLEX file.

Figure 1. Designer's main window.
Right click anywhere in the File Explorer right pane to display a New DLEX option.
After loading a DLEX file or choosing to create a new DLEX file, Designer is enabled.

Figure 2. The DynamicPDF Designer application main window.
Toolbar
The toolbar buttons along Designer's top are described from left to right.
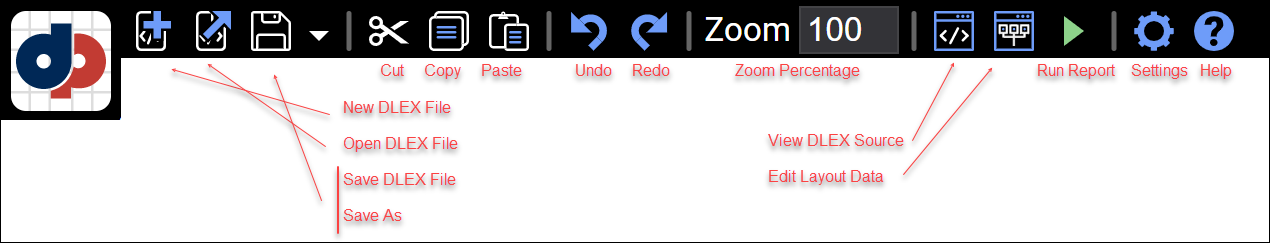
Figure 3 The DynamicPDF Designer's toolbar.
| Toolbar Button | Description |
|---|---|
| New DLEX File | Create a new DLEX file. |
| Open DLEX File | Open an existing DLEX file. |
| Save DLEX File/Save As | Save a new DLEX file or Save As to overwrite an existing DLEX file. |
| Cut | Cut to clipboard. |
| Copy | Copy to clipboard. |
| Paste | Paste from clipboard. |
| Undo | Undo the last command. |
| Redo | Redo the last command. |
| Zoom Percentage | Zoom by a percentage of 1 to 100. |
| View DLEX Source | View the DLEX file currently in Designer (read only). |
| Edit Layout Data | Edit the JSON layout data or create new layout data. |
| Run Report | Generate a PDF and display it in a separate browser window. |
| Settings | Settings. |
| Help | Help documentation. |
Main Navigation Button
Switch the application you wish to work with by selecting the desired tool in the main navigation button (the DynamicPDF image). You can switch between DynamicPDF Designer, Portal, and API and Help Documentation.
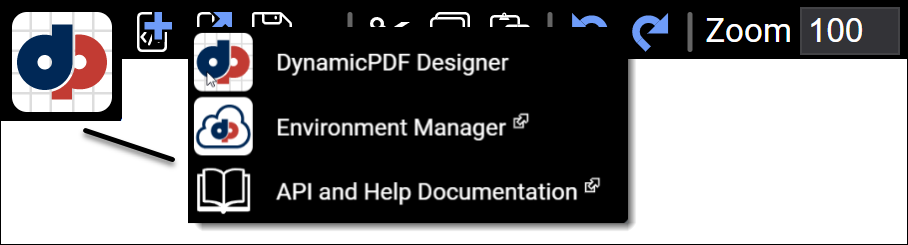
Figure 4. DynamicPDF Designer's main navigation button.
| Task | Description |
|---|---|
| DynamicPDF Designer | Opens DynamicPDF Designer. |
| Portal | Opens the Portal. |
| API and Help Documentation | Opens help documentation. |
New and Open DLEX File
Selecting the New DLEX File button opens the File Explorer. Selecting Open DLEX File opens the File Explorer with the Create button replaced with an Open button.

Figure 5. DynamicPDF Designer's File Explorer, creating or opening a DLEX file.
Right-click in the folder pane to create a new folder.
Adding a File
Drag resources from your local system to the Drag files here to upload to this folder button to add files to your cloud storage space using the File Manager.
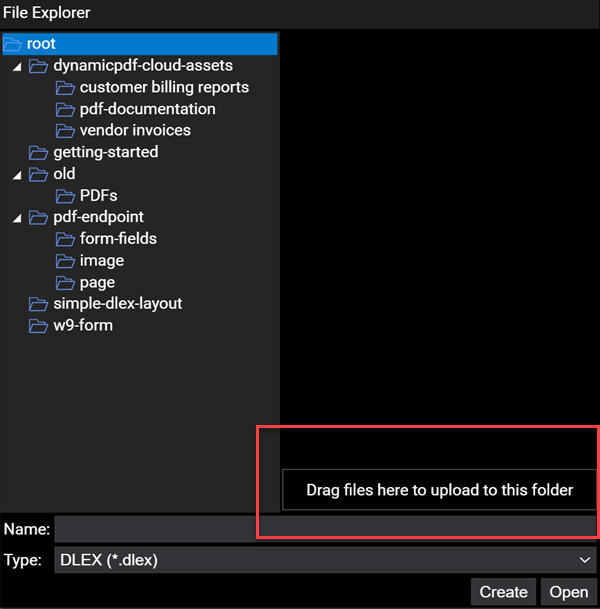
Figure 6. Add resources to your API resources by dragging local files to the Drag files here... button.
If you add a DLEX file and there is a JSON data file of the same name, then Designer will automatically load the JSON data file for you.
View DLEX Source
Selecting the View DLEX Source button opens the DLEX Source View.
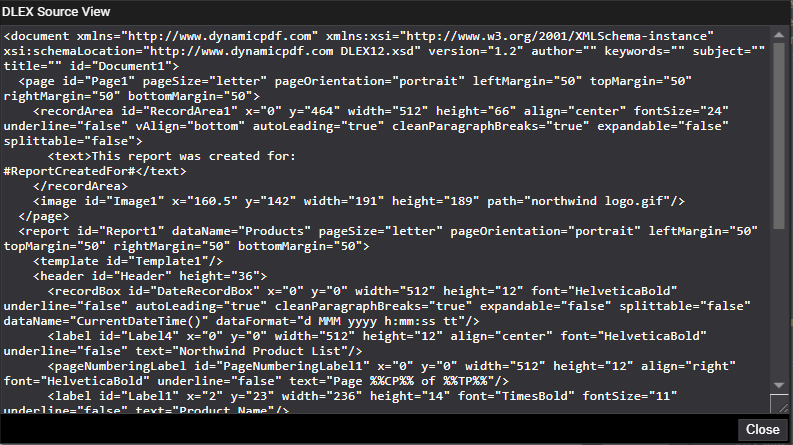
Figure 7. View your underlying DLEX file by selecting the DLEX Source View.
The DLEX Source View is read only. You must download the DLEX file to your local system if you wish to edit manually.
Edit Layout Data
The Edit Layout Data is where you add or modify the DLEX file's JSON data. You can open a pre-existing JSON data file using the File Explorer and also save the JSON data.

Figure 8. The Layout Data Editor displays your JSON dataset for your DLEX file.
Refer to JSON for more information on layout data.
Run Report
The Run Report button (the green arrow) will attempt to generate the PDF document from the DLEX file combined with the JSON dataset.

Figure 9. Create the PDF document by clicking the Run Report button.
Settings
In Settings you can snap values to a grid or show placeholders. Placeholders are only applicable to using Designer with the DynamicPDF Core Suite for .NET class's LayoutData and is not applicable to the DynamicPDF API.
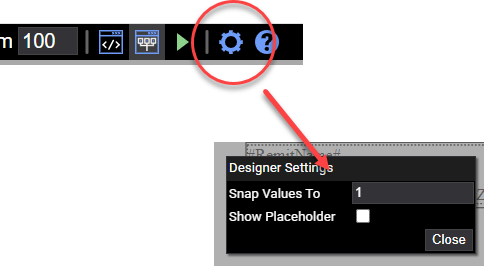
Figure 10. Settings button
Add Page and Add Report
The Add Page Button adds a new page to the Document Window while the Add Report button adds a new Report to the Document Window.

Figure 11. Create a new page or new report to a DLEX by selecting the Add Page or Add Report button.
Control Elements And Properties
You can add new pages and reports to the Document Window by selecting the Add Page or Add Report buttons.
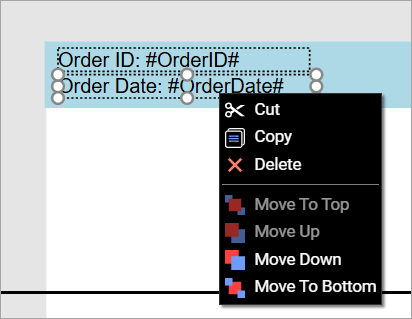
Adding Elements to a Page or Report
You add elements to a page or report by right-clicking and making a selection from the context menu.

Figure 12. Add elements to a DLEX file through the context menu.
You add RecordBox elements by dragging and dropping the JSON field name from the Data Explorer.

Figure 13. Adding a new element from the Data Explorer.
Right-click on any layout element to change its z-order.
Page
Upon creating a new page you are presented with a blank page. You can only add static elements and non-repeating top-level JSON fields to a page. Only valid selections are displayed in a page when you right-click and view the context menu (invalid choices are greyed-out).
Adding RecordBox or RecordArea
You can only add non-repeating top-level JSON fields to a page. For example, suppose you had the following simple JSON dataset.
{
  "Title":"My Report",
  "ReportCreatedFor": "Alex Smith",
  "Products": [
    {
      "ProductID": 17,
      "ProductName": "Alice Mutton",
      "UnitPrice": 39
    },
    {
      "ProductID": 3,
      "ProductName": "Aniseed Syrup",
      "UnitPrice": 10
    }
  ]
}
You could only add the Title and ReportCreatedFor elements to the page as a RecordBox or RecordArea. The repeating elements in the Products array must be added to a report rather than a page.
Page Properties
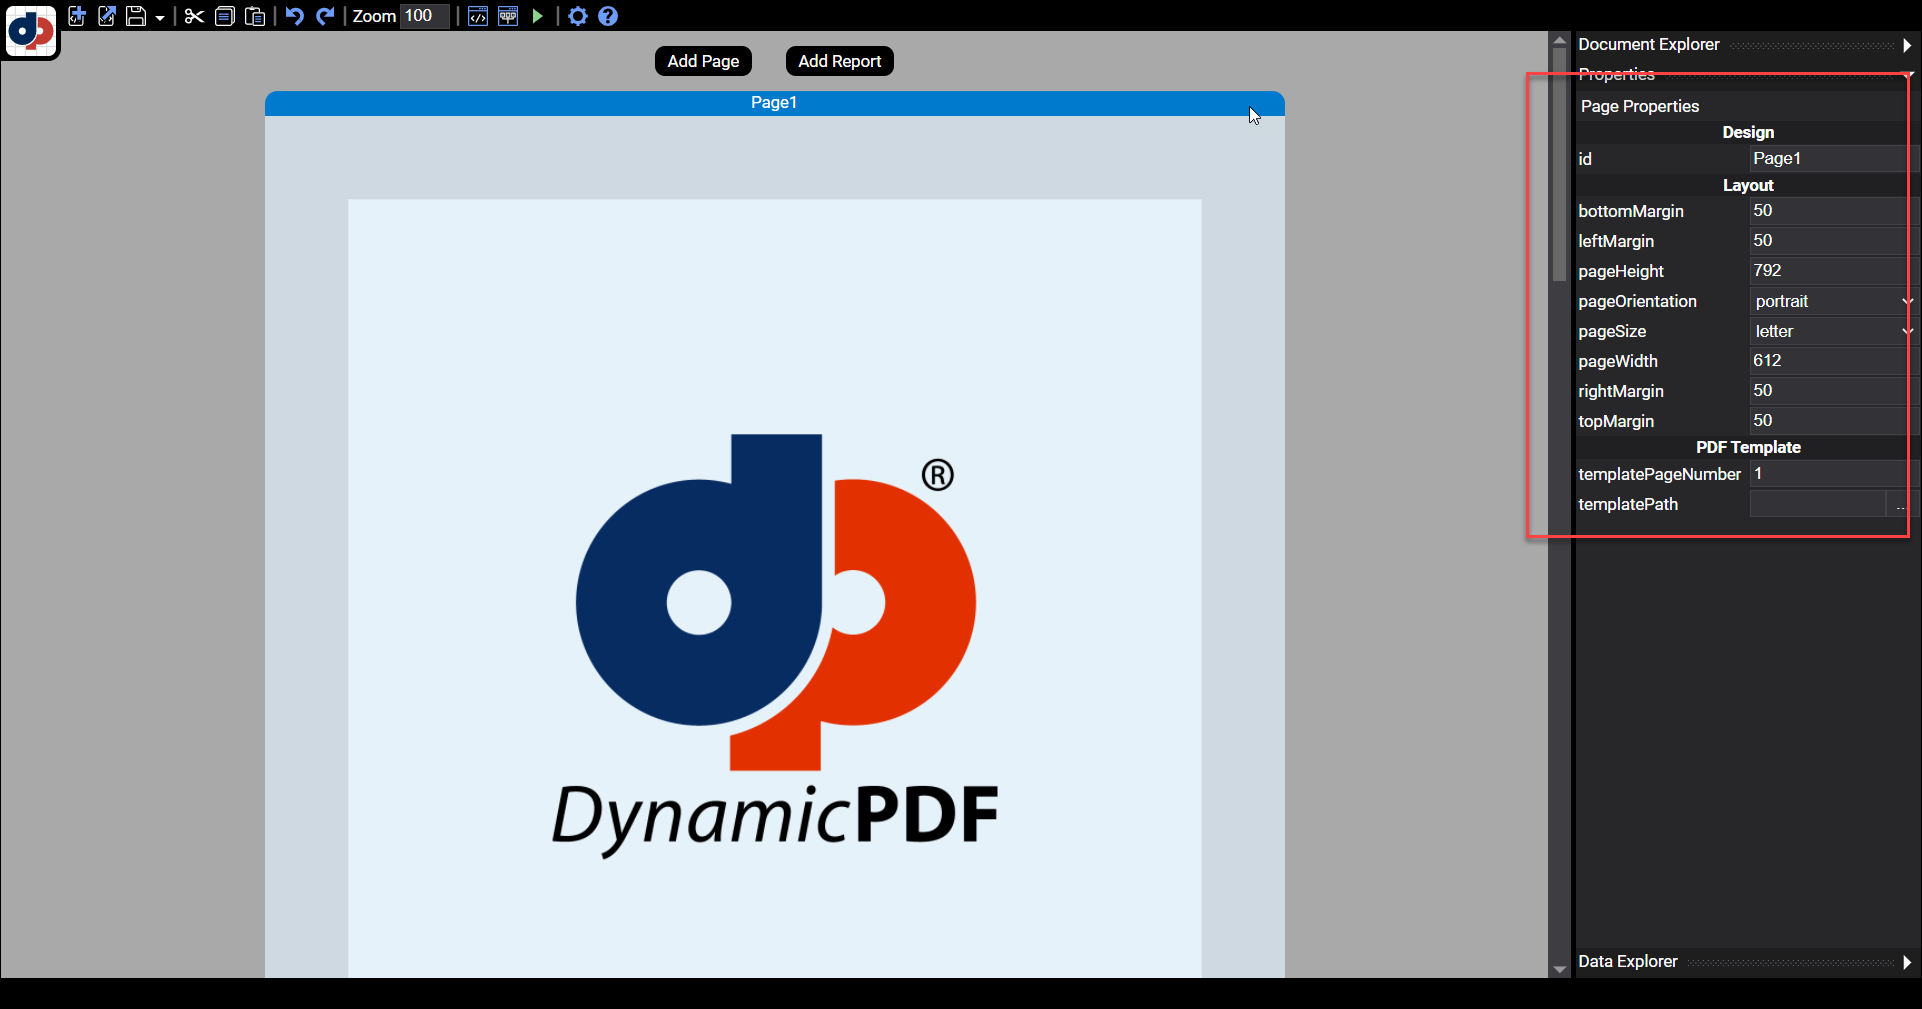
Figure 14. The Page Properties explorer.
The Page Properties explorer contains formatting properties for a page.
| Property | Description |
|---|---|
| bottomMargin | The bottom margin of the page dimensions in points (1/72 inches). |
| leftMargin | The left margin of the page dimensions in points (1/72 inches). |
| pageHeight | The page height in points (1/72 inches). |
| pageOrientation | Drop-down with two choices: portrait or landscape. |
| pageSize | Drop-down list of most page sizes. |
| pageWidth | The width of the page dimensions in points (1/72 inches). |
| rightMargin | The right margin of the page dimensions in points (1/72 inches). |
| topMargin | The top margin of the page dimensions in points (1/72 inches). |
| templatePageNumber | The page to take from the template to add to the page/report. |
| templatePath | The path to the PDF template. |
Report
You create a report by clicking the Add Report button. This adds a blank report with header, footer, and a body section. The header and footer contains non-repeating data fields and static data such as labels. The details contains the repeating report data from the JSON dataset.

Figure 15. The major sections of a report.
Report Properties
| Property | Description |
|---|---|
id | The identifier of the report. |
bottomMargin | The bottom margin of the report dimensions in points (1/72 inches). |
columnLayout | A value indicating how the data in the columns will be laid out. |
columnSpacing | The amount of space between columns. |
columns | The number of columns the report will have. |
leftMargin | The left margin of the report, dimensions in points (1/72 inches). |
pageHeight | The report height in points (1/72 inches). |
pageOrientation | Drop-down with two choices: portrait or landscape. |
pageSize | Drop-down list of most page sizes. |
pageWidth | The width of the report dimensions in points (1/72 inches). |
rightMargin | The right margin of the report dimensions in points (1/72 inches). |
rowSpacing | The amount of space between consecutive rows in the report. |
topMargin | The top margin of the report dimensions in points (1/72 inches). |
dataName | The name from the JSON data that repeats for each record. |
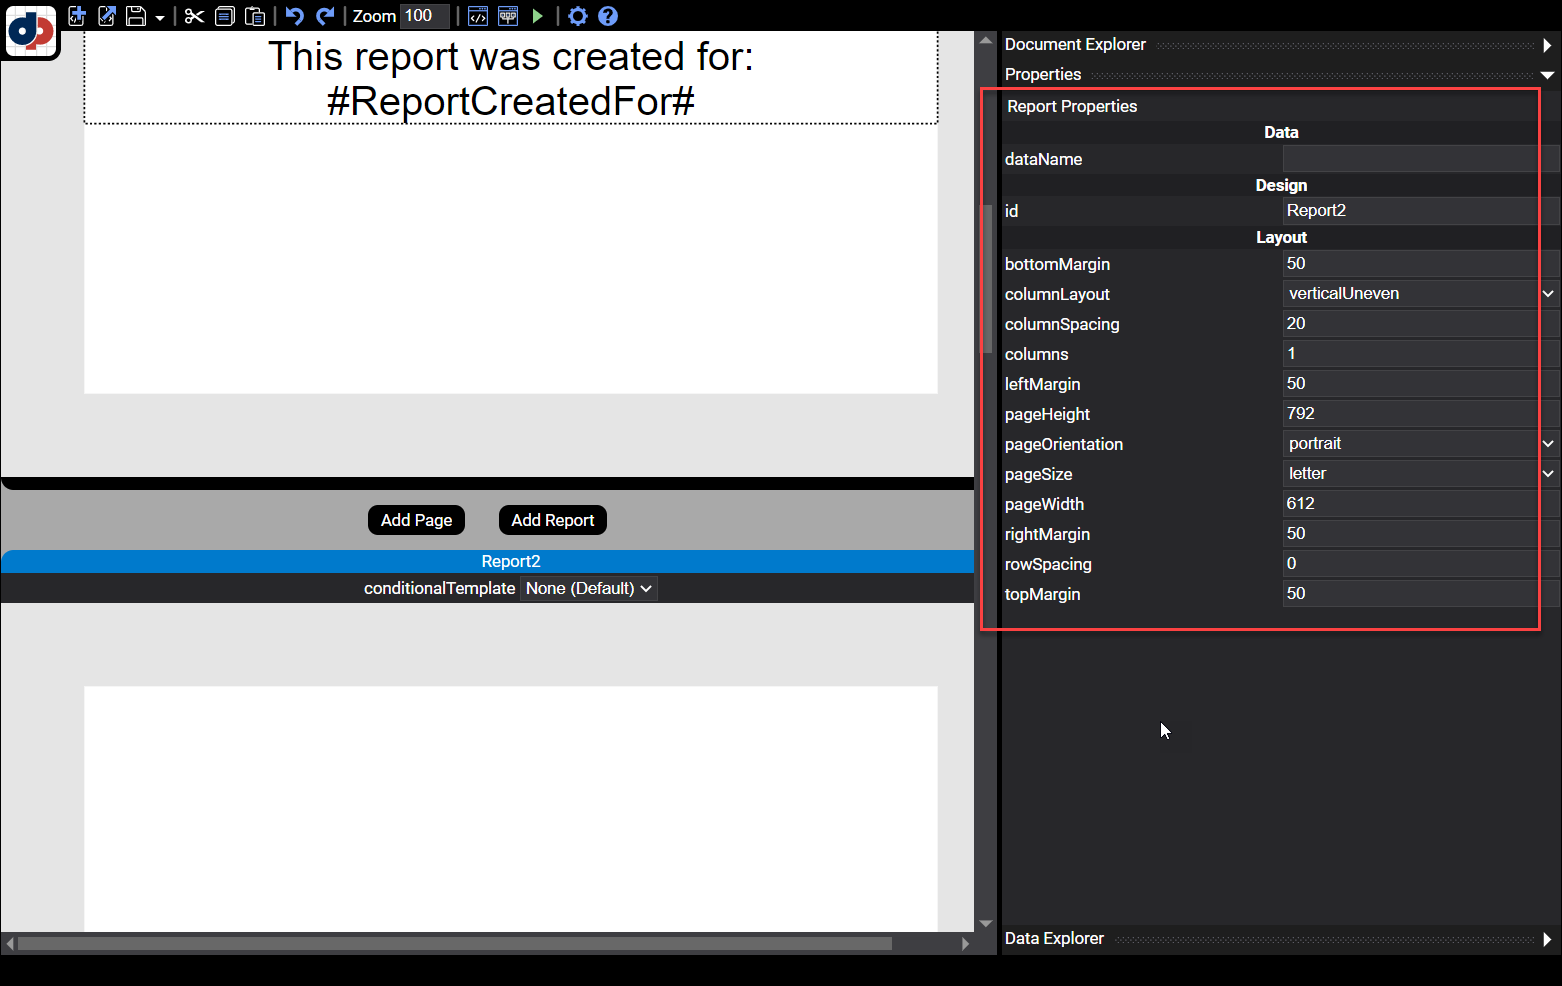
Figure 16. The Report Properties explorer.
This property specifies the manner in which the columns will be populated. The three options are explained below (default for a Report is verticalUneven, default for a Subreport is verticalEven):
horizontal- Records will appear horizontally across the columns. For instance, if a report has three columns, records will first be placed in column 1, then 2 then 3, then back to 1 and continue in this fashion. A column layout of horizontal will never be splittable.verticalUneven- Records will vertically fill column 1, then proceed to subsequent columns. This is the default layout.verticalEven- Records will vertically fill column 1, then proceed to subsequent columns. On the last page, theverticalEvenoption will layout the records so that they are as evenly displayed on the page as possible. For instance, if a report has three columns and the last page has 6 records to display, theverticalEvenlayout may display 2 records on each of the three columns. Where theverticalUnevenlayout may have just placed all 6 records in the first column.
Template
Templates are a powerful and easy way to add professional formatting to your reports. A template is added to a page or report. When added to a report, the template is divided into three sections, header, footer, and details in the report.
Refer to the tutorial, Creating a Report Using a Template, for a comprehensive example illustrating adding a template to a report.
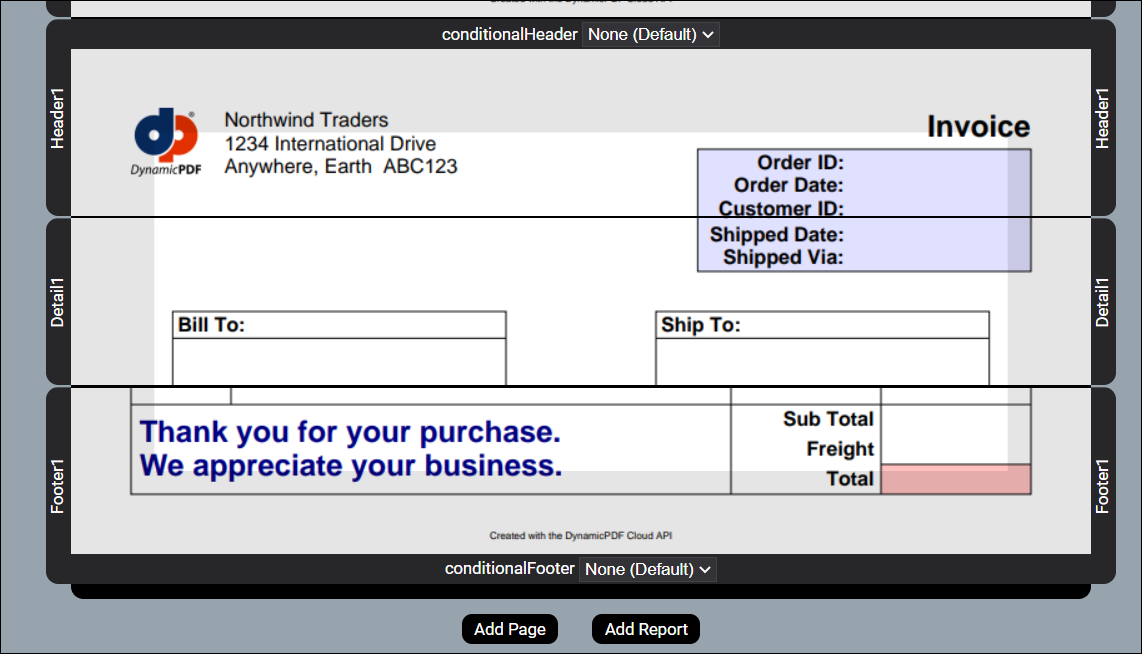
Figure 17. A template displayed in a DLEX report.
Resizing Template
When loading a template, you must resize the dimensions. For example, in the previous template, we resize the report's header, footer, left and right margins. We then must resize the header, footer, and details section's widths.
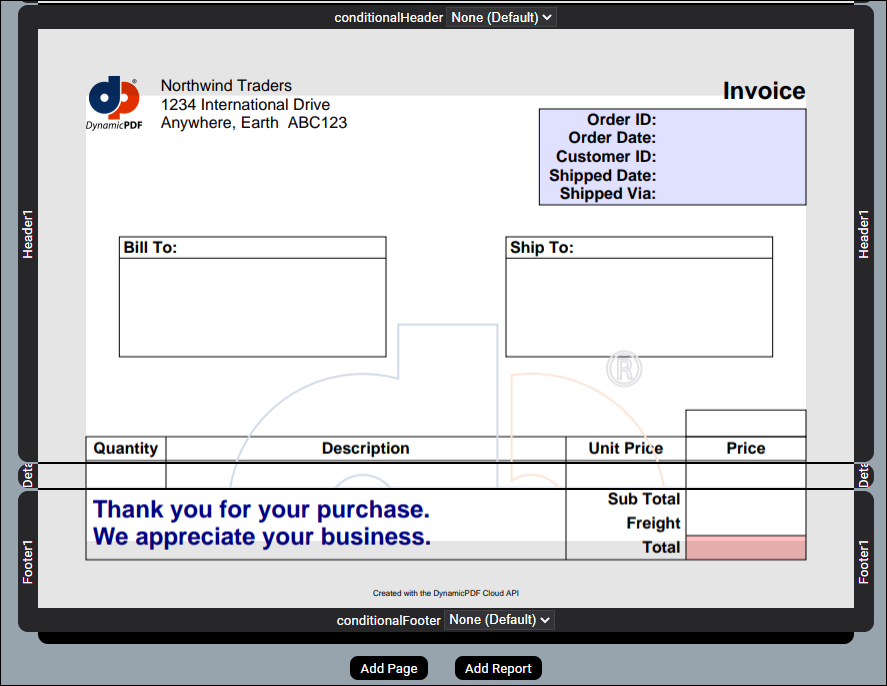
Figure 18. A template that matches the report's sizing.
Resizing
Resize the report to use the appropriate dimensions for a template using the following properties.
| Margin/Size | Element | Property |
|---|---|---|
| top margin | Report | topMargin |
| bottom margin | Report | bottomMargin |
| left margin | Report | leftMargin |
| bottom margin | Report | bottomMargin |
| header height | Report (header) | height |
| footer height | Report (footer) | height |
| details height | Report (details) | height |
Template Properties
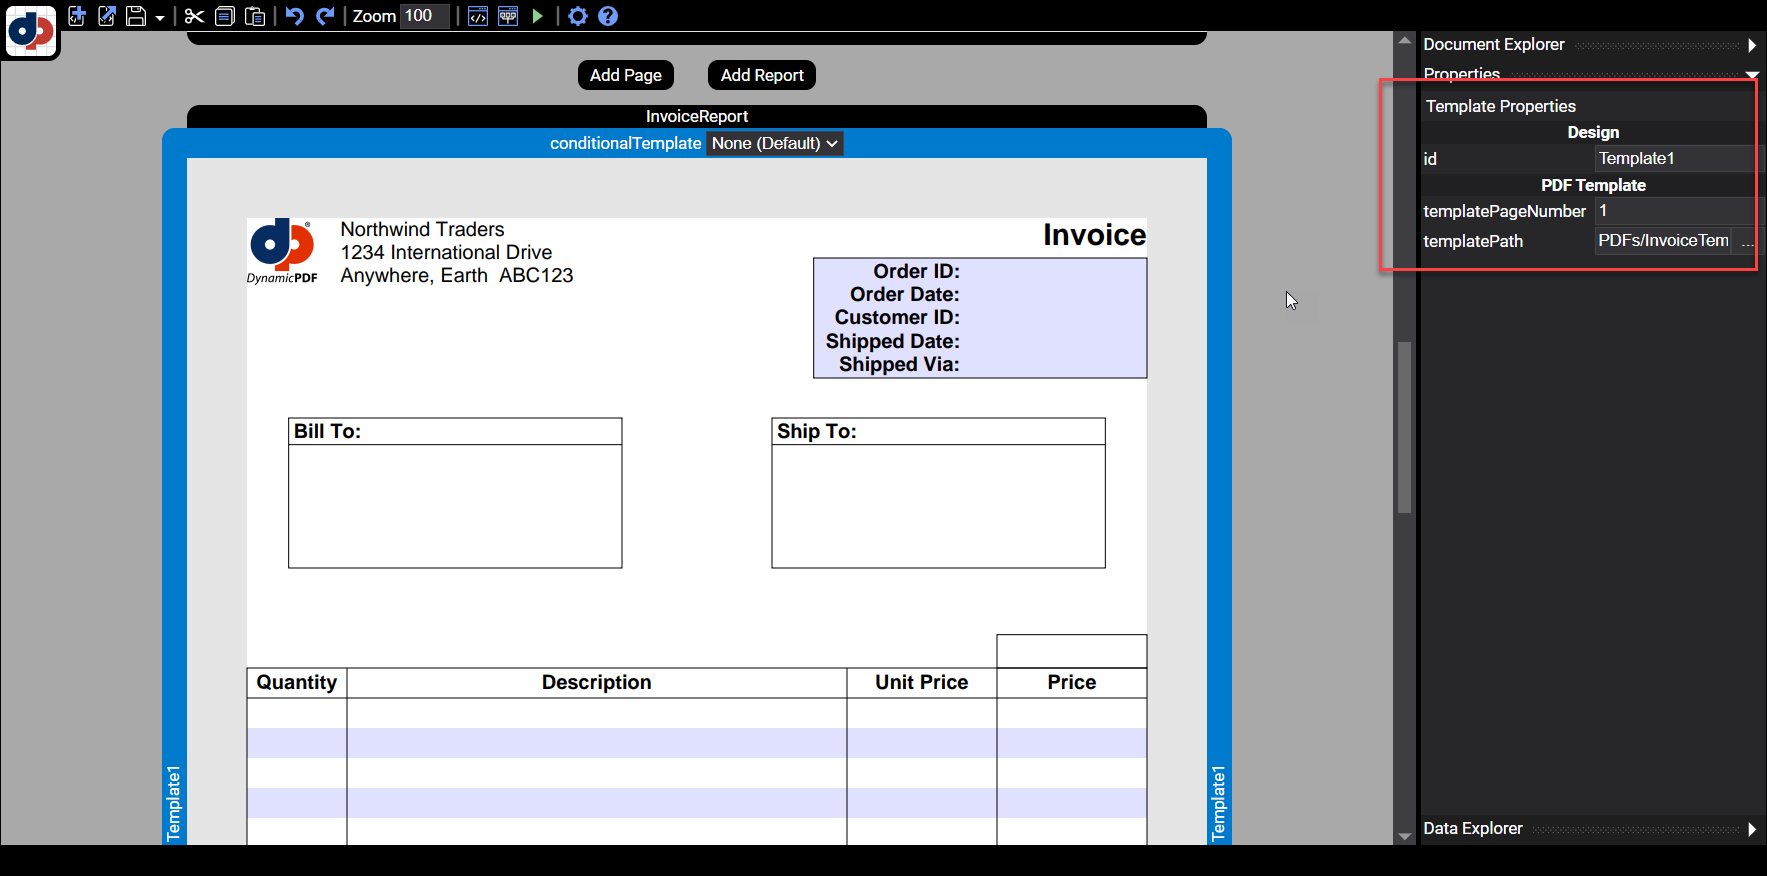
Figure 19. A template displayed in Designer.
| Property | Description |
|---|---|
id | The template's identifier. |
templatePageNumber | The page number of the template. |
templatePath | The path in File Manager to the PDF template. |
Header/Footer/Details
A report's header, footer, and details are used to space the report to display correctly when the JSON data is applied to generate the report. Each report section is displayed using the following logic.
- The header repeats for each page of data.
- The footer repeats for each page of data.
- The details repeats for each data row.
For example, suppose displaying all the data in a JSON dataset took three pages to display, the header and footer would be displayed three times. The details would be displayed for each row within the dataset.
Header
| Property | Description |
|---|---|
id | The unique identifier of the header. |
height | The height of the header section. |

Figure 20. A report's header and footer details displaying the Header Properties.
Footer
| Property | Description |
|---|---|
id | The unique identifier of the footer. |
height | The footer's height. |
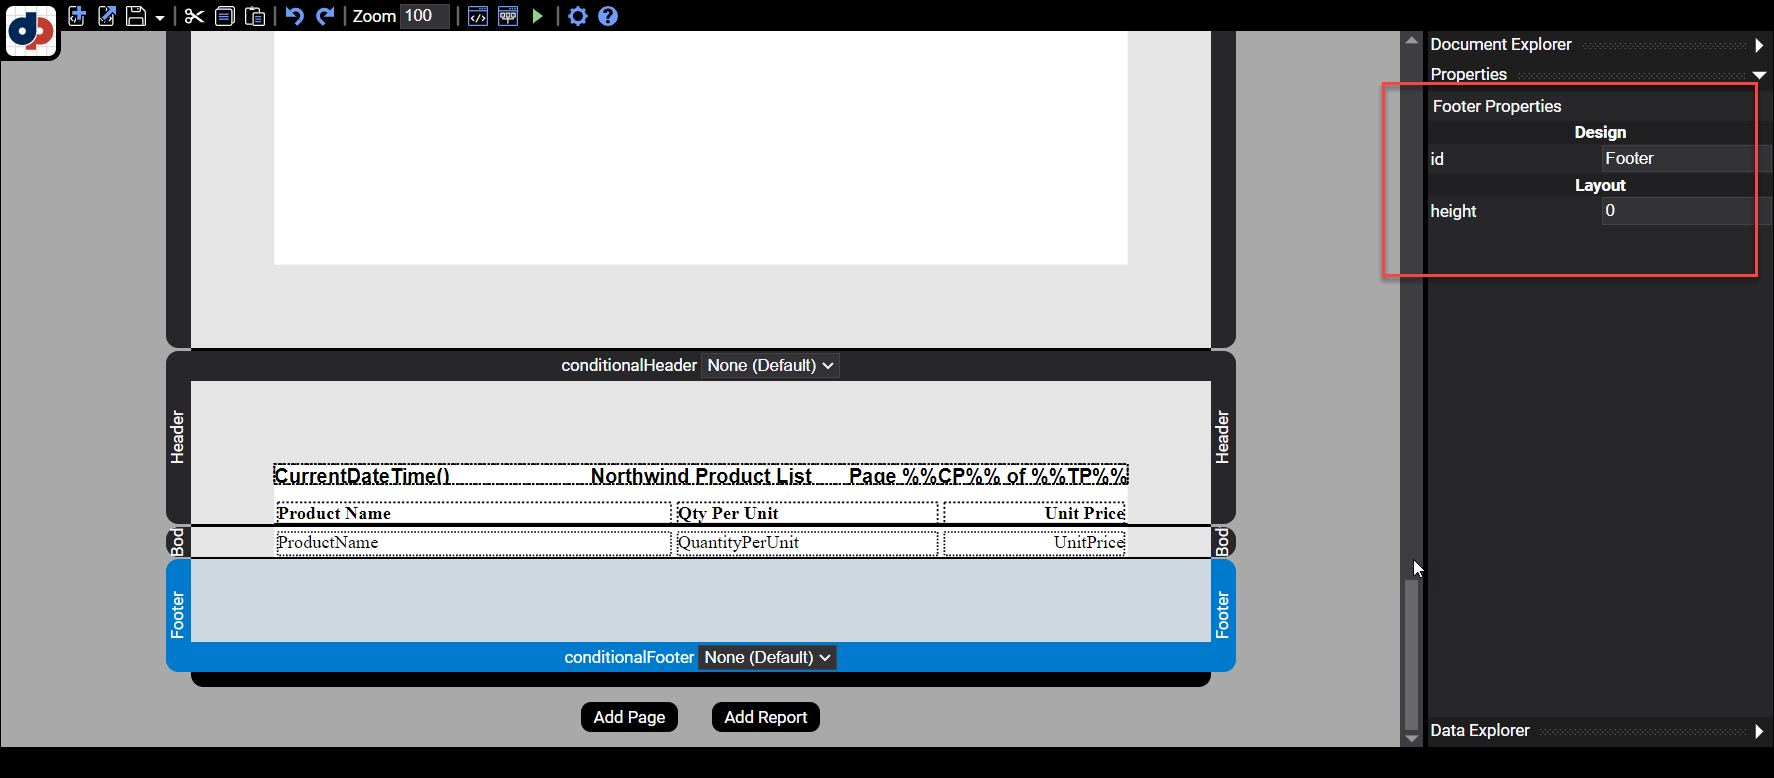
Figure 21. A report's header and footer details displaying the Footer Properties.
Body
| Property | Description |
|---|---|
id | The unique identifier of the body section. |
autoSplit | |
height | The height of the body section. |
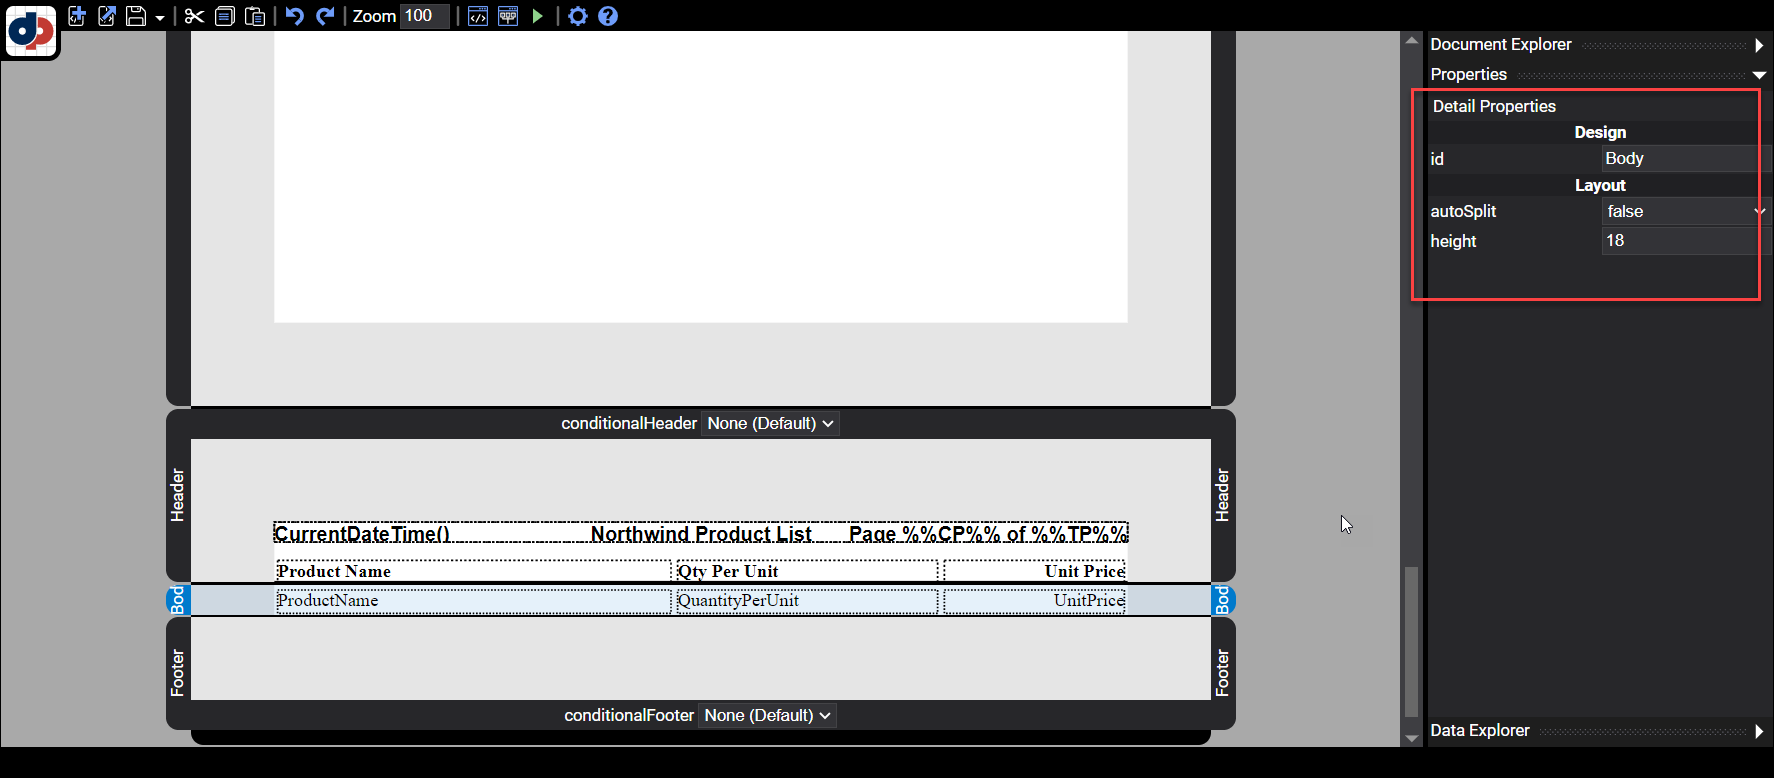
Figure 22. A report's Body and Detail Properties.